SSSS20 Tutorial
This page is for the tutorial for JDebloat SSSS20.
Overview
1. Setup
1.1 Import JDebloat via Docker
In our tutorial, we’ll use Docker to load an image of JDebloat. So please ensure that you have docker installed on your computer. You can download and install it for the official website.
Please download the lastest Docker image of JDebloat from here. After downloading, run the following command
$ docker load -i jdebloat_image.tgz
It may take a few minutes. If everything goes well, you’ll see
Loaded image: jdebloat:latest
There is also a Dockerfile, if you would like to build it yourself here.
Next, we’ll start the Docker image of JDebloat using
$ docker run -it jdebloat
After typing, you’ll enter the jdebloat folder in the Docker console:
[docker@3d6f4b8f5e83 ~]$
If you type
$ ls
You will see all files in the JDebloat folder:
data  jdebloat.py  README.mkd  scripts  Vagrantfile
doc   output       results     tools    examples
All paths from this point in the tutorial are rooted from here.
1.2 Directory Layout
The structure of directory is listing below:
jdebloat
├── README.mkd
├── data/
├── doc/
├── examples/
├── jdebloat.py
├── output/
├── results/
├── scripts/
└── tools/
- data - The benchmark folder. You can add new benchmarks to this folder.
- output - All run commands output files here.
- scripts - Summary results of the 25 default benchmarks
- tools - Source code of all individual tools.
Our framework automatically builds Java projects using mvn and extracts test cases.
All extracted test cases are listed in output/benchmark-id/initial/test.classes.txt.
Our framework assumes all test cases should pass before debloating. To exclude a test class, you can add the class name to data/excluded-tests.txt.
1.3 Help and Setup
You can run the entire JDebloat framework, including all three debloating tools in it, by running jdebloat.py.
The usage for this script can be listed with the help([-h]) option.
$ ./jdebloat.py -h
Output:
usage: jdebloat.py [-h] {clean,setup,run} ...

Run debloat tools in sequence.

Examples:
   ./jdebloat.py setup
        (setup environment for all tools)
or ./jdebloat.py setup jinline jshrink jreduce
        (essnentially the same as ./jdebloat.py setup)
or ./jdebloat.py run
        (run all tools on all benchmarks in the order of "jinline jshrink jreduce")
or ./jdebloat.py run jinline
        (run jinline only on all benchmarks)
or ./jdebloat.py run jinline jshrink jreduce
        (essnentially the same as ./jdebloat.py run)
or ./jdebloat.py run jshrink --benchmark=jshrink-test
        (run jshrink only on "jshrink-test" benchmark only)
or ./jdebloat.py clean
        (clean all debloating outputs)

positional arguments:
  {clean,setup,run}
    clean            Clean debloating outputs.
    setup            Setup environment for the specific tool(s).
    run              Run tool(s) in speficifed order.
                     Different orders can generate different debloating results.
                     The default sequence is "jinline jshrink jreduce".

optional arguments:
  -h, --help         show this help message and exit
The three positional arguments available for each tool in the package:
- Setup - to perform setup and compilation for the tool
- Run - to run tools on benchmark projects
- Clean - to perform cleanup for the tool
If you are interested in runing JDebloat on a specific benchmark, you can refer to the help message of the run command:
$./jdebloat.py run -h
Output:
usage: jdebloat.py run [-h] [--csv CSV] [-b BENCHMARK] [tools [tools ...]]

positional arguments:
  tools                 ['jinline', 'jshrink', 'jreduce']

optional arguments:
  -h, --help            show this help message and exit
  --csv CSV             Specify the <file name> of the benchmark csv file. The csv file should be put under data/ directory and be
                        like data/<file name>.csv. Using data/examples.csv by default.
  -b BENCHMARK, --benchmark BENCHMARK
                        Specify a certain project to debloat. Debloat all benchmarks by default.
All three debloating tools in JDebloat are pre-built and properly setup in this Docker image.
If you would like to build everything from scratch, you can clean and setup all the projects with the following command:
$ ./jdebloat.py clean
$ ./jdebloat.py setup
This setup process may take few minutes. If everything goes well, you should be able to see:
[INFO] ------------------------------------------------------------------------
[INFO] BUILD SUCCESS
[INFO] ------------------------------------------------------------------------
[INFO] Total time:  27.483 s
[INFO] Finished at: 2020-07-17T18:27:37Z
[INFO] ------------------------------------------------------------------------
Copying from /home/docker/jdebloat/tools/jreduce/.stack-work/install/x86_64-linux-tinfo6/lts-12.26/8.4.4/bin/jreduce to /home/docker/.local/bin/jreduce

Copied executables to /home/docker/.local/bin:
- jreduce
2. Adding a Project
2.1 Background Details
To add a new project, we need to add some basic details in a csv file under the data/ folder. Run the following commands:
$ ls data
By default, you will see at least two csv files present in the data folder, benchmarks.csv and examples.csv. benchmarks.csv contains the existing set of Java projects that the JDebloat tool has been tested on. examples.csv contains some basic Java projects to test JDebloat on.
By default, JDebloat reads data from data/examples.csv.
Let’s inspect the content in these two csv files:
$ head -n 3 data/benchmarks.csv
and you will see the following output.
id,url,rev
01,https://github.com/aragozin/jvm-tools,65ab61f56694426247ab62bb27e13c17de8c5953
02,https://github.com/ata4/disunity,6c1c3215419faaca427fa8d1e960f13cde76e766
JDebloat expects these csv files to be in the format above. The first line defines the header of the file, i.e. id,url,rev. id refers to a user provided unique value. url must point to a Git repository. rev is the commit hash in the repository, which specifies the revision of the Git repository to run JDebloat on. A csv file can have multiple rows, one row for each project to run JDebloat on.
2.2 Adding a new Java project to the benchmark
For this tutorial we’ll add the project “Maven Wrapper” as an example. To run JDebloat on Maven Wrapper, we need a csv file. The file data/tutorials.csv has already been created and the following contents show the process of creating it.
$ touch data/tutorial.csv
Now copy over the following lines inside data/tutorial.csv.
id,url,rev
ssss,https://github.com/takari/maven-wrapper,2528f4144d0e50f1e10d7e84c1fddd1edf88ce58
The id ssss is a user-provided identifier, the url points to Maven-Wrapper’s Github repository, and the rev is the commit hash for Maven-Wrapper. After setup, you can run the three tools inside JDebloat seperately or run all three tools in sequence on Maven-Wrapper.
Using the --csv argument, you can specifiy which benchmark csv file to use:
$ ./jdebloat.py run --csv=tutorial
or
$ ./jdebloat.py run --csv=tutorial jinline jshrink jreduce
By running all three debloating tools (jinline, jshrink and jreduce) in a sequence can give you the best debloating result. After running the above command, JDebloat will first download the project and then do the debloating. The output should be like:
[INFO] ------------------------------------------------------------------------
[INFO] BUILD SUCCESS
[INFO] ------------------------------------------------------------------------
[INFO] Total time:  50.268 s
[INFO] Finished at: 2020-07-17T18:34:05Z
[INFO] ------------------------------------------------------------------------
~/jdebloat/output/"id_of_project"/initial+jinline ~/jdebloat
Inliner: /home/docker/jdebloat/output/"id_of_project"/initial+jinline
Running original tests...
...
Generating inline targets...
Extracting original JAR files...
Transforming class files...
...
Processing : /home/docker/jdebloat/output/"id_of_project"/initial+jinline+jshrink
...
Getting classpath information for module "maven-package"...
Done getting classpath information for module "maven-package"!
Running callgraph analysis for module "maven-package"...
...
~/jdebloat/output/"id_of_project"/initial+jinline+jshrink+jreduce ~/jdebloat
...
xx:xx:xx │ ├ stdout (bytes: 360529): a29dcf66
xx:xx:xx │ ├ stderr (bytes: 00000): e3b0c442
xx:xx:xx │ ├ success
xx:xx:xx │ └ 31.321s
Each project in the benchmark has a corresponding output folder output/benchmark-id, with the following subfolders:
- benchmark - to perform setup and compilation for the tool
- initial - contains the compilation output of the Java project (s)
- initial+tool(s) - contains the debloating output of the Java project
Each subfolder with JAR files contains a stats.csv file with size statistics. The origional size of the Maven-wrapper project can be viewed in output/ssss/initial/stats.csv:
id,name,size,methods,classes,fields,instructions,tests
ssss,initial,91499,206,35,68,3257,19
After execution, you should be able to get the following output:
=====================================================================
                          Debloating Stats:
=====================================================================
Using debloating tool(s): jinline->jshrink->jreduce
Benchmark ssss:
  Size before debloating: 91499
  Size after  debloating: 24506
  Size reduction: 73.22%
  Total test cases before debloating: 19
  Total test cases after  debloating: 19, (19 successes, 0 failures)
Detailed debloating stats can be viewed in output/ssss/initial+jinline+jshrink+jreduce/stats.csv:
id,name,size,methods,classes,fields,instructions,tests
ssss,initial+jinline+jshrink+jreduce,24698,64,11,32,1332,19
The result shows JDebloat makes 73.01% reduction on the Maven-Wrapper project.
3. JSHRINK
JShrink takes a java project as input and removed uninvoked methods and classes based on static and dynamic call graph analysis. While this functionality is similar to JRed, it differs in three major ways. First, in order to identify call targets invoked using Java reflection, JShrink uses TamiFlex reflection call analysis, thus improving the safety of method removal. JShrink also leverages JMtrace, a native profiling agent using JVM TI API, which captures the use of dynamic features in Java code and augments static reachability analysis in JShrink. Secondly, JShrink removes the body of each uninvoked method and inserts a custom warning message to indicate where debloating has been applied. Third, JShrink allows various options for entry points such as all main methods, all public methods (excluding tests), and/or all JUnit tests.
You can find more details of JShrink in here.
3.1 Run JShrink on the Maven-Wrapper project
To run the JShrink tool, run
$ ./jdebloat.py run jshrink --csv=tutorial --benchmark=ssss
The JDebloat framework will only run JShrink and print out the debloating result as follows:
=====================================================================
                          Debloating Stats:
=====================================================================
Using debloating tool(s): jshrink
Benchmark ssss:
  Size before debloating: 91499
  Size after  debloating: 69419
  Size reduction: 24.13%
  Total test cases before debloating: 19
  Total test cases after  debloating: 19, (19 successes, 0 failures)
Again, you can get detailed stats data in output/ssss/initial+jshrink/stats.csv:
ssss,initial+jshrink,69419,206,35,68,3257,19
3.2 Inspect Debloated Java Classfiles
JShrink and other tools in JDebloat perform code size reduction at the bytecode level. To inspect how a classfile is debloated, you need to use a classfile disassembler javap.
In this section, we will first demonstrate how to use javap. If you are familiar with javap. You can skip this section.
Java bytecode is the instruction set for the Java Virtual Machine. It acts similar to an assembler which is an alias representation of a C++ code. As soon as a java program is compiled using javac command, java bytecode is generated in the form of a .class file.
Here is a very simple java program. You can also download it from here.
class Simple {
  public static void main(String args[]) {
    System.out.println("hello java");
  }
}
Then we use the following command to get the Simple.class file.
$ javac Simple.java
The javap command disassembles a class file. The javap command displays information about the fields,constructors and methods present in a class file. You can use the javap -c command to see disassembled code. The code that reflects the java bytecode.
$ javap -c Simple
Output:
Compiled from "Simple.java"
class Simple {
  Simple();
    Code:
       0: aload_0
       1: invokespecial #1                  // Method java/lang/Object."<init>":()V
       4: return

  public static void main(java.lang.String[]);
    Code:
       0: getstatic     #2                  // Field java/lang/System.out:Ljava/io/PrintStream;
       3: ldc           #3                  // String hello java
       5: invokevirtual #4                  // Method java/io/PrintStream.println:(Ljava/lang/String;)V
       8: return
}
Some of the important options of javap tool are as follows.
| Option | Description |
|---|---|
| -help | prints the help message. |
| -l | prints line number and local variable |
| -c | disassembles the code |
| -s | prints internal type signature |
| -sysinfo | shows system info (path, size, date, MD5 hash) |
| -constants | shows static final constants |
| -version | shows version information |
3.3 Run JShrink on a Simple Project
To illustrate how JShrink performs code size reduction on a project, we create a simple Java project called jshrink-test under /examples/jshrink-test.
First, run the following command to run JShrink on the example project:
$ ./jdebloat.py run jshrink --benchmark=jshrink-test
You should see the debloating result as following at the end of the execution:
=====================================================================
                          Debloating Stats:
=====================================================================
Using debloating tool(s): jshrink
Benchmark jshrink-test:
  Size before debloating: 17506
  Size after  debloating: 14162
  Size reduction: 19.10%
  Total test cases before debloating: 3
  Total test cases after  debloating: 3, (3 successes, 0 failures)
You can look at output/ssss/initial+jshrink/stats.csv for detailed information.
You can use the disassemble.sh script to disassemble both input jar file and output jar file. Then you can use vimdiff to compare the code before and after debloating.
$ ./scripts/disassemble.sh jshrink jshrink-test
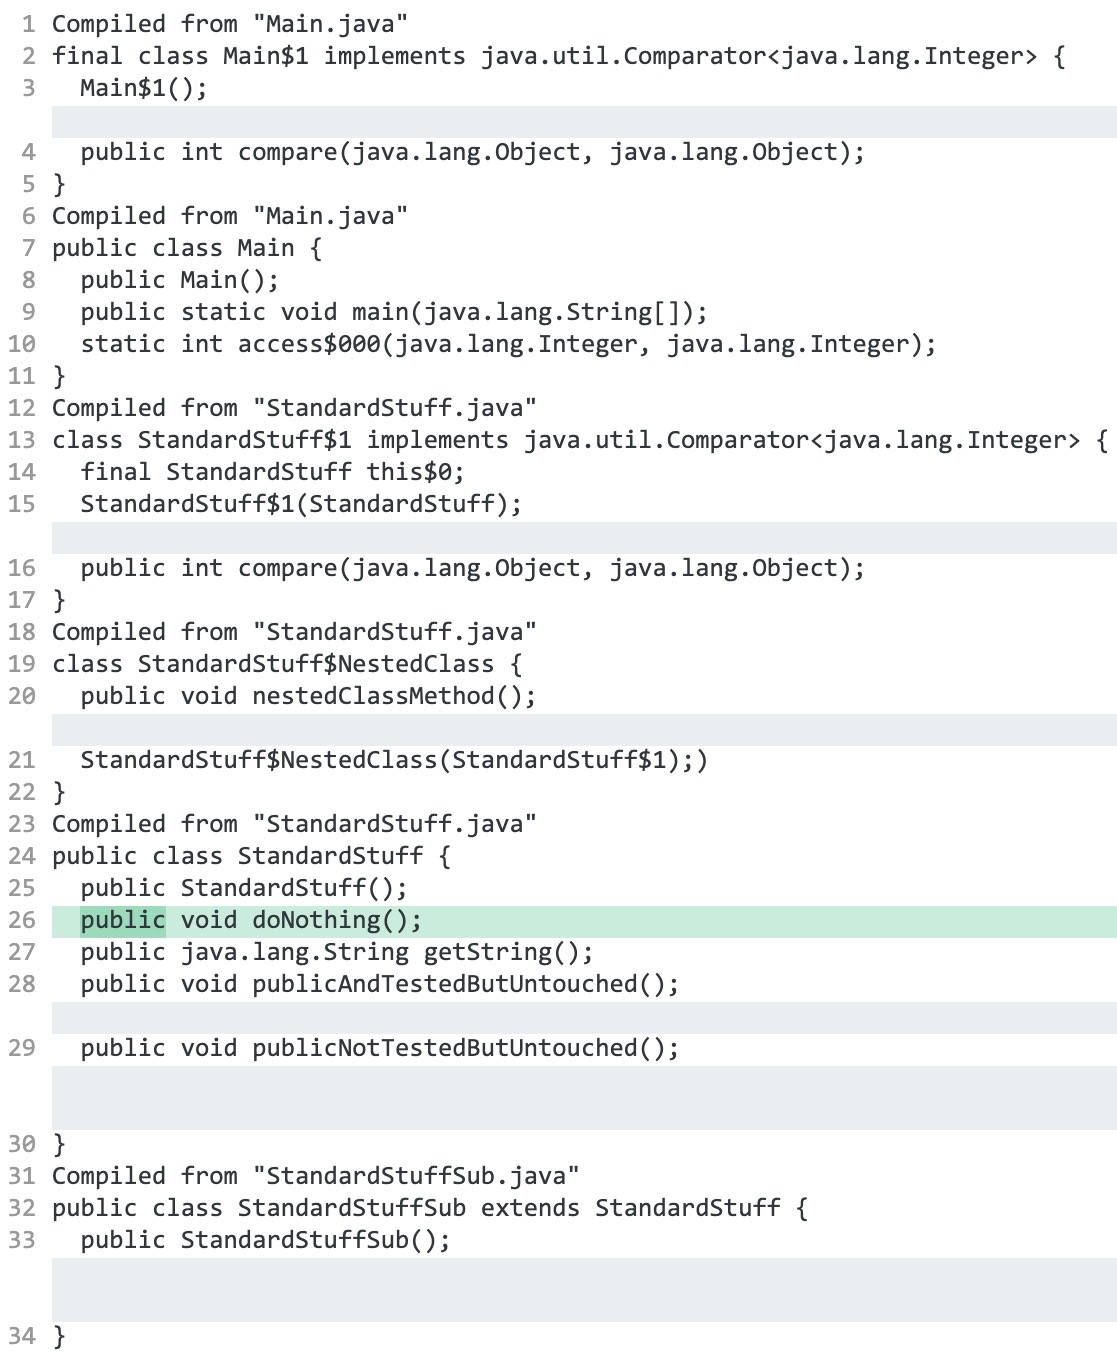
We can see that unused methods are removed after running jshrink.
Original version:
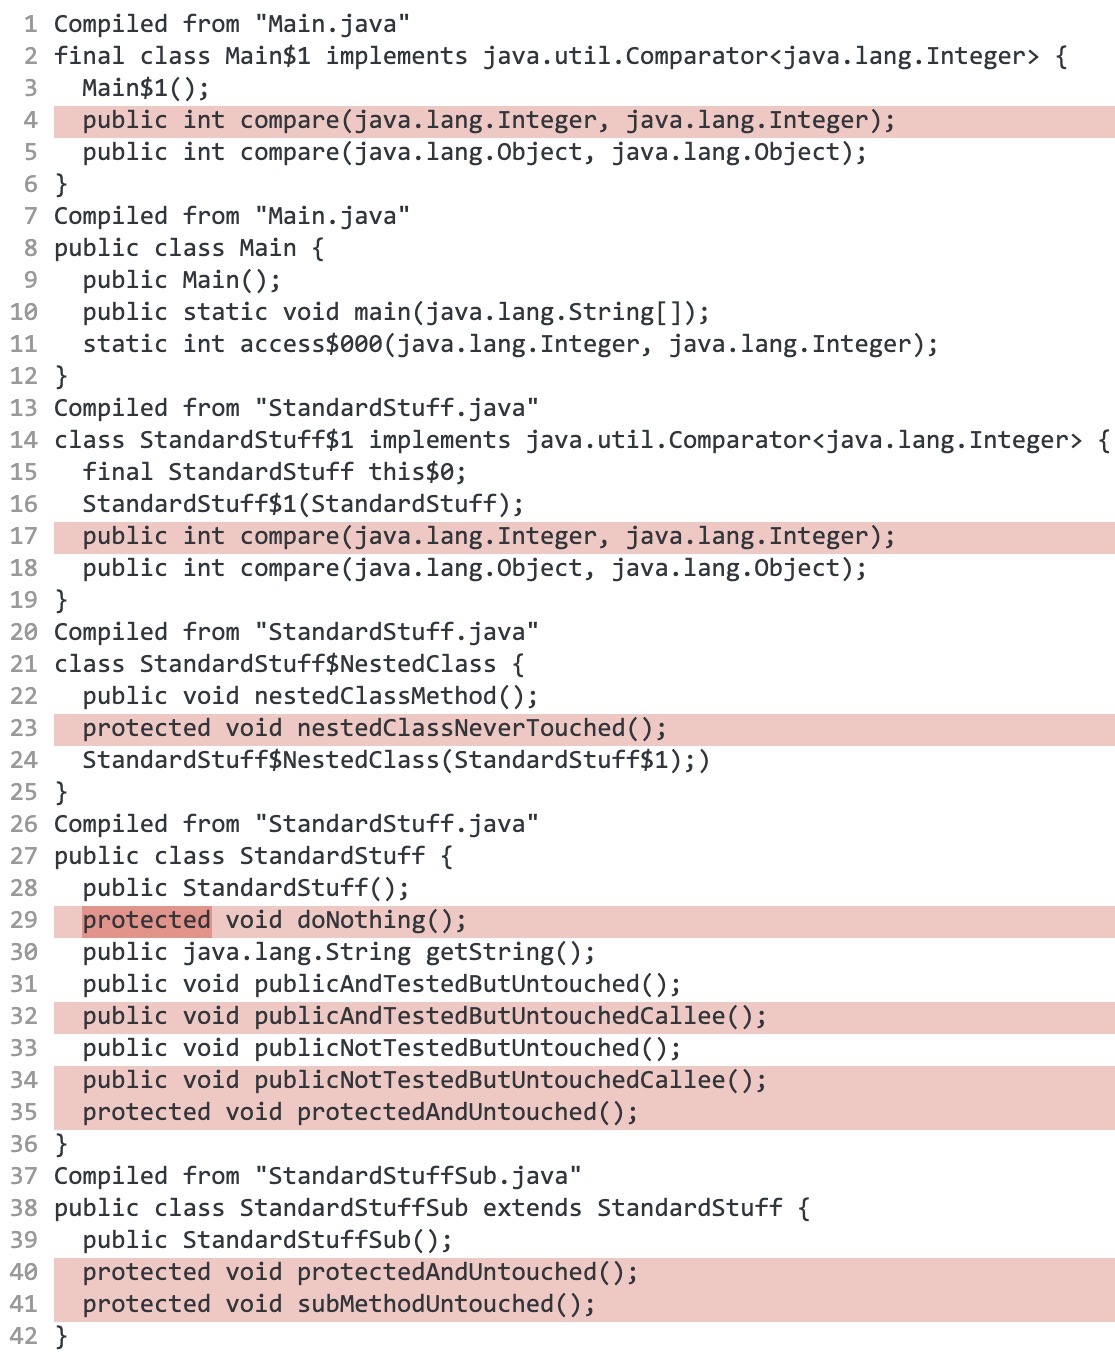
After JShrink:
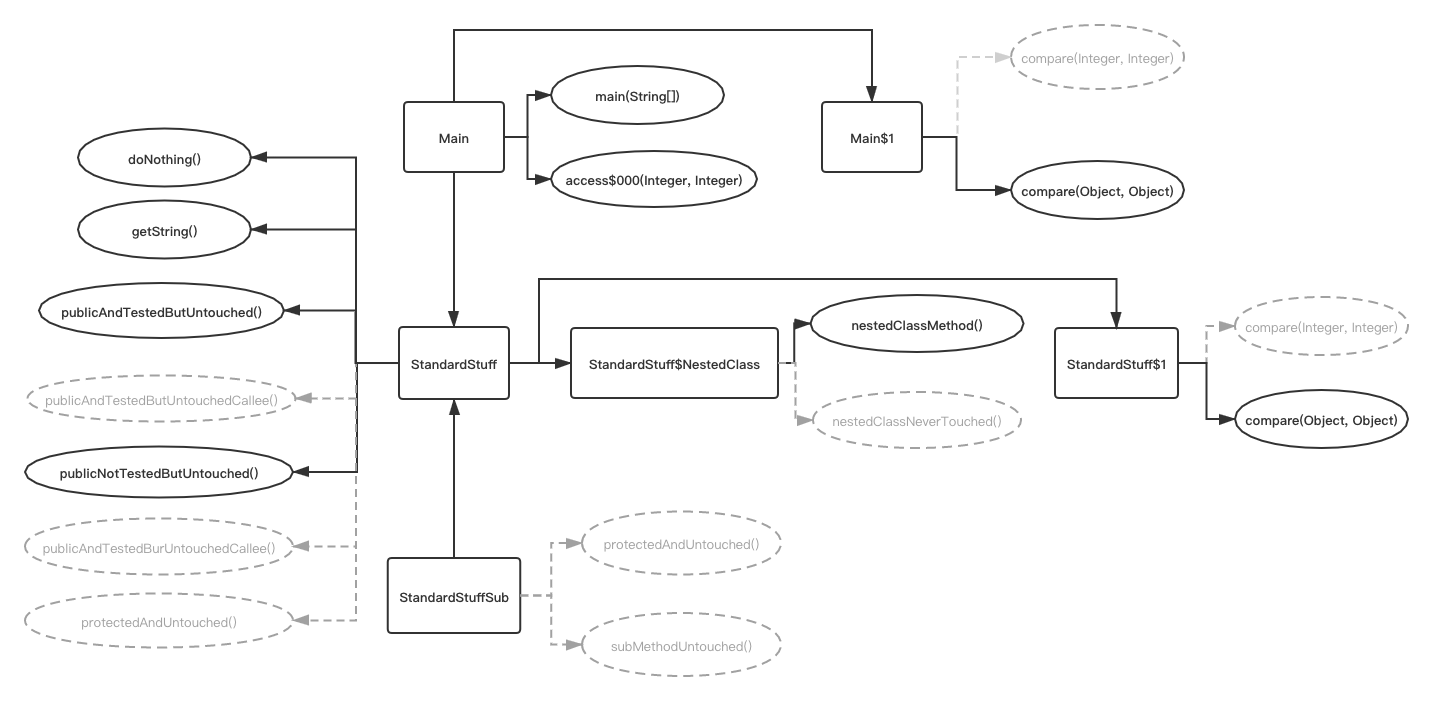
And here is the call graph for jshrink-test. We can see after running jshrink on this simple application, methods in grey color are removed.
4. JINLINE
JInline takes a Java program and statically inlines methods read from a database.
We first provide aggressive inline parameters to the JVM. While these parameters are not suitable for running programs, they provide better inlining information. We extract the inlining decisions from the JVM into a database for later use.
We use to our customized database to inform our static inliner. First, we filter out aggressive inlinings which would cause the Java program to miscompile. Using this information, our Inliner tool uses the Soot Bytecode optimization framework to statically inline method calls without affecting the semantics of the program.
You can check here for more information about JInline
4.1 Run JInline on Maven-wrapper:
To run the JInline tool, run:
$ ./jdebloat.py run jinline --csv=tutorial --benchmark=ssss
Same as others, jdebloat should print out debloating results as follows:
=====================================================================
                          Debloating Stats:
=====================================================================
Using debloating tool(s): jinline
Benchmark ssss:
  Size before debloating: 91499
  Size after  debloating: 74941
  Size reduction: 18.10%
  Total test cases before debloating: 19
  Total test cases after  debloating: 19, (19 successes, 0 failures)
4.2 Run JInline on a Simple Example
By simply running:
$ ./jdebloat.py run jinline --benchmark=jinline-test
You should get the debloating result as follows:
=====================================================================
                          Debloating Stats:
=====================================================================
Using debloating tool(s): jinline
Benchmark jinline-test:
  Size before debloating: 3607
  Size after  debloating: 1202
  Size reduction: 66.68%
  Total test cases before debloating: 1
  Total test cases after  debloating: 1, (1 successes, 0 failures)
The example is present under examples/jinline-test. The example program has a basic use case of debloating a polymorphic callsite from an application using dynamic analysis.
$ cd examples/jinline-test
There are two main subfolders, Application and Library. Looking at Application/src/main/java/Application.java
public class Application {
  public static int doubleOrSquare(int val, boolean isDouble) {
    Doer doer = null;
    if (isDouble) {
      Doubler doubler = new Doubler();
      doubler.foo(val % 2);
      doer = doubler;
    }
    else {
      Squarer squarer = new Squarer();
      squarer.bar(val * 3 + 4);
      doer = squarer;
    }

    if (val > 100) {
      val = 100;
    }
    else if (val < 0) {
      val = 0;
    }

    int result = doer.doIt(val);
    return result;
  }
}
The main elements of the Application.java file are:
- A parent class
Doer, with two childrenDoublerandSquarer - A polymorphic call at line
22to functiondoIt. - A branch condition (line
4) based on the variableisDoublethat decides the target of the polymorphic call at line22.
Here’s the Class Hierarchy Diagram of the classes Doer, Doubler and Square, defined under Library/src/main/java/edu/ucla/cs/onr/test:
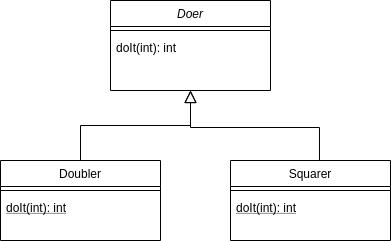
Esentially, if we knew the variable isDouble to be either true or false for all runs of the program, we could always know the target of the doIt at line 22. For example, if we knew that isDouble = true, we would know that doer is of type Doubler from line 7, and thus inline Doubler.doIt at line 22, esentially debloating the whole Squarer class from the program.
Since knowing the value of isDouble statically is not possible for an arbitrary program, JInline uses test cases provided by the developer to exercise the codebase, and exploit such callsites. For this example, we have a simple test case present under Application/src/test/java/ApplicationTest.java.
The test case calls doubleOrSquare, with the value of isDouble as true. JInline uses this test case to exercise the program, notices the receiver of the polymorphic call doIt is always Doubler, and inlines Doubler.doIt at line 22 in Application.java, esentially removing the Squarer class from the program.
The output of JInline is present under the output/jinline-test/initial+jinline folder.
To see the original jar file with no inlining, type:
$ javap -cp output/jinline-test/initial/app.jar -c Application
To see the debloated jar file with Doubler.doIt inlined, type:
$ javap -cp output/jinline-test/initial+jinline/app+lib.after.jar -c Application
Notice how on line 65 there is an invokevirtual instruction. The debloated jar instead has Doubler.doIt inlined in its place, and there is no invokevirtual.
Initial
 public static int doubleOrSquare(int, boolean);
    Code:
       0: aconst_null
       ...
       ...
       65: invokevirtual #8                  // Method edu/ucla/cs/onr/test/Doer.doIt:(I)I
       68: istore_3
       69: iload_3
       70: ireturn
Initial+Jinline
  public static int doubleOrSquare(int, boolean);
    Code:
       0: iload_1
       ...
       ...
       50: iconst_2
       51: imul
       52: istore_0
       53: goto          56
       56: iload_0
       57: ireturn
5. JREDUCE
JReduce is an input reducer, which focuses on using Java Bytecode as inputs. Input reduction works like this: given an input that produces some behavior in a program, it gradually removes parts of the input while ensuring a program behaves the same.
You can check here for more information about JReduce.
5.1 Run JReduce on Maven-wrapper:
To run the JReduce tool only:
$ ./jdebloat.py run jreduce --csv=tutorial --benchmark=ssss
Like the others, you should see the debloating stats at the end of the execution:
=====================================================================
                          Debloating Stats:
=====================================================================
Using debloating tool(s): jreduce
Benchmark ssss:
  Size before debloating: 91499
  Size after  debloating: 30586
  Size reduction: 66.57%
  Total test cases before debloating: 19
  Total test cases after  debloating: 19, (19 successes, 0 failures)
5.2 Run JReduce on a Simple Example:
In this tutorial, we are going to focus on two things. First, we will show how we can use an input reducer as a debloater, and then we will show why JReduce is uniquely suited to reduce Java Bytecode.
Let’s navigate to and consider the code in examples/jreduce-test/.
$ cd examples/jreduce-test/
The main code in src/main/java/ contains seven classes:
$ ls src/main/java
A.java B.java C.java D.java E.java F.java Main.java
The most interesting is Main.java:
public class Main {

  public static String getGreeting(String name) throws Exception {
    return Main.class.getClassLoader().loadClass(name).newInstance().toString();
  }

  public static void main(String[] args) throws Exception {
    System.out.println(getGreeting(args[0]));
  }
}
It contains a getGreeting method that given the name of a class, loads and instantiate the class, through reflection, and returns it’s toString methods. We can also see that the main method just prints the greeting from the class in the first argument. Let’s try it:
$ mvn compile # First, we compile the example
$ java -cp target/classes Main A
Hello, A!
And if we inspect A that is what we expected:
public class A {
  public String toString() {
    new B();
    return "Hello, A!";
  }
}
Let’s now say we want to produce the smallest program that still writes “Hello, A!” to the screen when we run it with “A”. This is a tough task for any static analysis, because it would not know the input “A”. Instead it could overapproximate and preserve all the classes, or underapproximate and don’t include “A”. Both scenarios are not ideal.
Input reduction to the rescue. Because input reduction is a hybrid technique, it can test any input and back-track if it produces a different output than expected. We can consider classes as an input to java -cp {} Main "A", where {} indicate the position of the input, and we want to produce the smallest input that still outputs Hello, A!.
jreduce -W WORK-FOLDER -O output INPUT -- PROGRAM [ ARGS .. ]
$ jreduce -W workfolder -o reduced target/classes/ -- java -cp {} Main A
After nine (0000 to 0008) iterations, it produces a minimal program with only four classes.
$ ls reduced
A.class B.class C.class Main.class
And, we can also see that it still produces the output:
$ java -cp reduced Main A
Hello, A!
Great! We have debloated the example program and reduced the size by 57% while preserving the program’s behavior! We can investigate what JReduce did by looking in the work folder:
$ ls workfolder/000*/classes
workfolder/0000/classes:

workfolder/0001/classes:
A.class  B.class  C.class  Main.class

workfolder/0002/classes:

workfolder/0003/classes:
Main.class

workfolder/0004/classes:
A.class  B.class  C.class

workfolder/0005/classes:
A.class  B.class  C.class

workfolder/0006/classes:
A.class  B.class  C.class  Main.class

workfolder/0007/classes:
A.class  B.class  C.class  Main.class

workfolder/0008/classes:
A.class  B.class  C.class  Main.class
Now, let’s talk about why JReduce is exceptionally smart. We could also reduce the program using ddmin, the original input reducer program. However, this might produce invalid programs. We can set up JReduce to use ddmin -R ddmin and to not check that each input is correct -S item:
$ jreduce -S item -R ddmin -W ddmin-workfolder -o ddmin-reduced target/classes/ -- java -cp {} Main A
First, we see that this takes 22 iterations, but also that the output is invalid. While it works for “A”, it does not work for “B”, even though “B” is included in reduced program.
$ java -cp ddmin-reduced Main A
Hello, A!
$ java -cp ddmin-reduced Main B
Exception in thread "main" java.lang.NoClassDefFoundError: C
	at B.toString(B.java:3)
	at Main.getGreeting(Main.java:4)
	at Main.main(Main.java:8)
Caused by: java.lang.ClassNotFoundException: C
	at java.net.URLClassLoader.findClass(URLClassLoader.java:382)
	at java.lang.ClassLoader.loadClass(ClassLoader.java:424)
	at sun.misc.Launcher$AppClassLoader.loadClass(Launcher.java:349)
	at java.lang.ClassLoader.loadClass(ClassLoader.java:357)
	... 3 more
We can see that ddmin did not include C even though it is mentioned in B:
public class B {
  public String toString() {
    new C();
    return "Hello, B!";
  }
}
JReduce achieves better and more correct reduction by modeling the dependencies between the classes. If one class mentions another we add a dependency from it to the other. The dotted edges from Main indicate the possible “dynamic” dependencies, which is not part of the model.
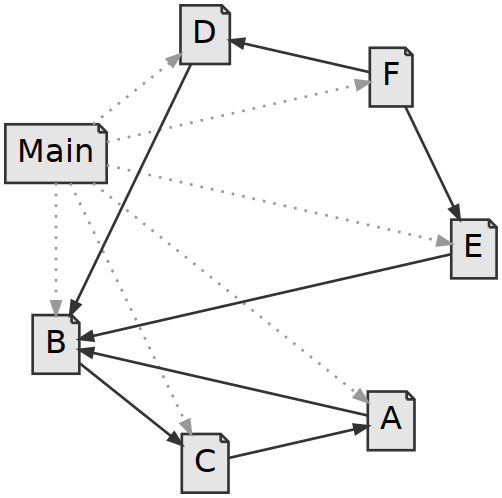
The key insight is that every transitive closure in this graph corresponds to a valid sub-input. We can see that (Main, A, B, C) is a transitive closure in the graph, and that (Main, A, B) is not. JReduce can use this model to effectively go through the valid input programs, and never produce an invalid input.
One added benefit of this model is that we can start specifying knowledge about the system. For example, we know that the main class required in any executable program. So we tell JReduce that it needs to be part of the core:
$ jreduce --core Main -W fast-workfolder -o fast-reduced target/classes/ -- java -cp {} Main A
Now, it only takes six iterations to get to the right answer!
$ ls fast-workfolder/0*/classes
fast-workfolder/0000/classes:
Main.class

fast-workfolder/0001/classes:
A.class  B.class  C.class  E.class  Main.class

fast-workfolder/0002/classes:
Main.class

fast-workfolder/0003/classes:
A.class  B.class  C.class  Main.class

fast-workfolder/0004/classes:
A.class  B.class  C.class  Main.class

fast-workfolder/0005/classes:
A.class  B.class  C.class  Main.class
This was a quick overview of JReduce. We are currently improving the tool to also reduce methods and fields. To do this we had to describe the model of valid sub-inputs using logic instead of a graph. Our preliminary results shows a 5.3 times improvement, so stay tuned!